_edited_edited.png)
Essential Recruiting Metrics to Improve Hiring in 2025
- Janis Kolomenskis
- Jun 2
- 24 min read

Unlocking Hiring Success with Data-Driven Insights
Want to supercharge your recruiting efforts and attract top-tier talent? This listicle reveals eight essential recruiting metrics to boost your hiring success. We'll cover key performance indicators (KPIs) like Time to Fill, Cost per Hire, and Quality of Hire, empowering you to optimize your strategy, minimize expenses, and build a winning recruitment process. Learn how to track these crucial recruiting metrics and gain valuable insights into your recruitment funnel's performance. Let's get started!
1. Time to Fill
Time to Fill is a crucial recruiting metric that measures the efficiency of your hiring process. It represents the number of days it takes to fill an open position, starting from when the job requisition is created to when a candidate accepts the offer. For recruiters in Baltics region, understanding and optimizing Time to Fill can be the difference between securing top talent and losing out to competitors. This metric provides valuable insights into your recruitment pipeline, helping you identify bottlenecks, streamline your processes, and ultimately hire faster. Are you ready to supercharge your hiring efforts? Let's dive in!

Time to Fill is calculated by simply counting the calendar days between the date a job posting goes live and the date a candidate accepts the offer. This seemingly simple metric unlocks a wealth of information about your hiring efficiency. By segmenting Time to Fill by department, role level, or even location, you gain a granular view of where your process excels and where it needs improvement. For instance, are engineering roles taking significantly longer to fill than marketing roles? This data empowers you to pinpoint specific areas for optimization.
Why Time to Fill Matters in the Baltics Region:
In the competitive Latvia market, speed and efficiency are paramount. Top candidates are often in high demand, and a lengthy hiring process can lead to losing them to other organizations. By tracking and optimizing Time to Fill, you can ensure a swift and positive candidate experience, boosting your employer brand and attracting top-tier talent. Think of Time to Fill as a vital sign for your recruitment health – a healthy Time to Fill translates to a healthy talent pipeline.
Features and Benefits of Tracking Time to Fill:
Visibility into Pipeline Efficiency: Gain a clear understanding of how long each stage of your recruitment process takes, from initial screening to final interviews.
Bottleneck Identification: Pinpoint specific stages that are causing delays, such as slow approval processes or scheduling difficulties.
Seasonal Hiring Pattern Recognition: Identify peak hiring periods and adjust your recruitment strategy accordingly.
Benchmarking: Compare your Time to Fill against industry standards and identify areas for improvement.
Resource Planning and Budgeting: Accurately forecast hiring timelines and allocate resources effectively.
Success Stories:
Several companies have achieved remarkable results by focusing on Time to Fill:
Google: By implementing structured interviews, Google slashed their Time to Fill by a staggering 50%, significantly improving their hiring efficiency.
Unilever: Leveraging AI-powered screening tools, Unilever dramatically reduced their Time to Fill from an average of 4 months down to just 4 weeks!
Netflix: Maintaining an impressive 30-day average Time to Fill across all roles, Netflix demonstrates the power of a streamlined and efficient hiring process.
Actionable Tips for Optimizing Time to Fill:
Set Realistic Benchmarks: Consider role complexity and market conditions when establishing target Time to Fill metrics.
Track Separately for Different Job Categories: Recognize that different roles may have varying hiring timelines.
Identify Common Delay Points: Analyze your current process and pinpoint areas where delays frequently occur.
Balance Speed with Quality of Hire: While speed is important, don't compromise the quality of your hires for the sake of a faster Time to Fill.
Pros and Cons:
While Time to Fill is a valuable metric, it’s crucial to be aware of its limitations:
Pros:
Easy to calculate and understand
Helps identify process inefficiencies
Enables benchmarking against industry standards
Useful for resource planning and budgeting
Cons:
Doesn't account for hiring quality
May encourage rushed hiring decisions
Can be influenced by external market factors
Doesn't reflect candidate experience quality
By understanding and effectively utilizing Time to Fill, you can significantly enhance your recruitment process, secure top talent in Latvia, and build a thriving organization. So, start tracking, start optimizing, and watch your hiring success soar!
2. Cost per Hire
Cost per Hire (CpH) is a crucial recruiting metric that provides a tangible measure of how much your organization spends to bring a new employee on board. It's a powerful tool, especially for organizations in Latvia, where attracting top talent often requires significant investment. By understanding and tracking CpH, you gain valuable insights into the efficiency of your recruitment processes and the return on investment (ROI) of your hiring strategies. This metric absolutely deserves its place on this list because it translates your recruiting efforts into a quantifiable figure, allowing for data-driven decisions and optimized budget allocation.
How It Works: The Formula for Success
The calculation itself is straightforward:
CpH = (Internal Recruiting Costs + External Recruiting Costs) / Number of Hires
Let's break down these components:
Internal Recruiting Costs: These encompass the expenses incurred within your organization. Think recruiter salaries, the time spent by HR and hiring managers on interviews and onboarding, and the costs associated with your applicant tracking system (ATS).
External Recruiting Costs: This category includes expenses paid to external vendors or platforms. Examples include job advertising fees on platforms like LinkedIn or Indeed, agency fees, recruitment event costs, and background check expenses.
Unlocking the Power of CpH: Features and Benefits
CpH offers several key features that make it a powerful metric:
Granular Analysis: CpH can be calculated for specific roles, departments, or even individual sourcing channels. This granular approach allows you to pinpoint areas of strength and weakness in your recruiting strategy. For instance, you might discover that hiring software engineers through employee referrals is significantly more cost-effective than using a recruitment agency.
Comparative Analysis: By tracking CpH over time and comparing it across different hiring methods, you can evaluate the effectiveness of your recruitment investments. Are your social media campaigns generating hires at a reasonable cost? Is one job board outperforming another? CpH provides the data you need to answer these critical questions.
Budget Optimization: Armed with CpH data, you can make informed decisions about where to allocate your recruitment budget. This allows you to maximize your resources and ensure you're getting the best bang for your buck. In Latvian market, optimizing your budget is crucial for attracting and securing the best talent.
The Good and the Not-So-Good: Pros and Cons
Like any metric, CpH has its strengths and weaknesses:
Pros:
Clear ROI: CpH provides a tangible ROI on your recruitment activities. It helps justify your spending and demonstrate the value of your efforts to stakeholders.
Budget Optimization: As mentioned earlier, CpH is essential for effective budget allocation, helping you maximize your resources and minimize unnecessary spending.
Sourcing Channel Effectiveness: Compare the CpH of different sourcing channels to identify which ones are delivering the best results.
Data-Driven Decisions: CpH empowers you to make data-driven hiring decisions, moving away from gut feelings and toward a more strategic approach.
Cons:
Complex Calculation: While the basic formula is simple, accurately capturing all internal and external costs can be complex and time-consuming.
Long-Term Success: CpH doesn't necessarily reflect the long-term success or quality of a hire. A lower CpH doesn't guarantee a high-performing employee.
Industry and Role Variations: CpH can vary significantly between industries and role levels, making direct comparisons challenging.
Quality of Hire: CpH doesn't account for the quality of hire. A lower cost per hire might be tempting, but it's crucial to consider whether the candidates hired are contributing effectively to the organization.
Real-World Success: Examples in Action
Several organizations have achieved significant cost savings by optimizing their CpH. For instance, IBM reduced CpH by 30% using predictive analytics to identify the most promising candidates. Marriott decreased CpH from $2,000 to $1,200 through employee referrals, demonstrating the power of leveraging internal networks. Salesforce optimized its CpH by focusing on high-performing channels and streamlining its recruitment process.
Actionable Tips for Latvian Recruiters
Here are some practical tips for effectively utilizing CpH in your recruitment strategies:
Comprehensive Cost Tracking: Be meticulous in tracking all direct and indirect costs related to recruitment, including staff time, software subscriptions, and advertising fees.
Channel-Specific Tracking: Track CpH by sourcing channel to identify your best performers and optimize your channel mix. In Latvia, understanding which channels are most effective is paramount.
Quality Over Quantity: While CpH is important, don't sacrifice quality of hire for cost savings. Consider quality metrics alongside CpH to ensure a holistic view of your recruitment success.
Regular Review and Updates: The recruitment landscape is constantly evolving. Regularly review and update your CpH calculations to ensure accuracy and relevance.
By incorporating these tips and diligently tracking your CpH, you can significantly improve the efficiency and effectiveness of your recruitment efforts, ultimately contributing to the success of your organization in Latvia's business environment.
3. Quality of Hire
Quality of Hire is arguably the most important recruiting metric, even though it can be one of the most challenging to measure. It moves beyond simply filling roles and focuses on the value new hires bring to your organization. Think of it as the ultimate ROI of your recruitment process. Instead of asking "how many people did we hire?", Quality of Hire asks "how impactful were the people we hired?" This metric dives deep into the long-term success of your hiring decisions, analyzing performance ratings, retention rates, cultural fit, and even the impact on team dynamics. It's about finding employees who not only excel in their roles but also thrive within your company culture and contribute to its overall success. For businesses in the competitive Baltics region, attracting and retaining top talent is crucial, making Quality of Hire a critical metric to track.

Quality of Hire works by combining several key performance indicators, creating a holistic view of a new hire's contribution. It's not a snapshot in time; rather, it's measured over a period of 6-24 months post-hire, providing a much more accurate assessment of their true potential and impact. This long-term perspective allows you to see how well new hires integrate into the team, develop their skills, and contribute to company objectives. This metric often includes performance ratings, retention data, engagement scores, and even internal mobility metrics. Critically, Quality of Hire can be tracked by hiring source and even by individual recruiter, providing valuable insights into which channels and recruiters are delivering the highest quality talent.
So, why does Quality of Hire deserve a prominent place in this list of recruiting metrics? Simply put, it's the best indicator of the true success of your recruitment efforts. It goes beyond vanity metrics like time-to-fill and cost-per-hire, focusing on the long-term value brought in by each new employee. This metric empowers you to identify your best sourcing channels, refine your hiring practices, and ultimately, align your recruitment strategy with your overall business outcomes. Imagine being able to pinpoint the sourcing channels consistently delivering high-performing, engaged employees – that’s the power of Quality of Hire!
Examples of Successful Implementation:
Industry giants have embraced Quality of Hire as a core metric. Microsoft, for instance, tracks 18-month performance ratings to assess the quality of their hires. Amazon utilizes internal mobility rates as a key indicator of employee satisfaction and development, reflecting the quality of initial hires. Johnson & Johnson correlates hiring source with 2-year retention rates, identifying which channels are bringing in employees who stay and contribute for the long haul. These examples demonstrate how Quality of Hire can be tailored to specific organizational needs and used to drive strategic hiring decisions.
Pros:
Measures the true success of recruitment efforts, focusing on long-term value.
Helps identify the most effective sourcing channels for top-tier talent.
Supports continuous improvement in hiring practices and candidate experience.
Directly aligns recruitment strategies with overall business outcomes.
Cons:
Can be complex to measure and standardize across different roles and departments.
Requires long-term tracking and patience to gather meaningful data.
Can be influenced by factors beyond recruitment, such as management and training.
Subjective elements in performance evaluations can introduce some bias.
Actionable Tips for Latvian Businesses:
Define clear quality metrics upfront: Decide which indicators (performance ratings, retention, engagement, etc.) are most important for your organization and how you will measure them.
Track multiple indicators for a comprehensive view: Don't rely on a single metric. Combine several indicators to get a more holistic understanding of quality.
Segment by role type and hiring source: Analyze Quality of Hire data by specific roles and sourcing channels to identify areas for improvement and optimize your strategy.
Use data to refine sourcing strategies: Focus on the channels and recruiters delivering the highest quality hires and adjust your approach accordingly. For example, if employee referrals consistently yield high-performing employees, prioritize and invest more in your referral program.
Consider the Latvia context: Factor in the unique dynamics of Latvia's job market, including competition and industry-specific talent pools, when defining your Quality of Hire metrics.
By focusing on Quality of Hire, organizations in the Latvia region can build a strong, engaged workforce that drives success and fuels sustainable growth. It's an investment in your future, ensuring you're not just filling positions, but building a team of high-performing individuals who contribute to your company's long-term vision.
4. Source of Hire: Unlock Your Recruitment Powerhouse
Want to supercharge your recruiting efforts and build a dream team? Look no further than the "Source of Hire" metric! This powerful tool unveils the secret weapon for optimizing your recruitment strategy, maximizing your ROI, and attracting top-tier talent in Latvia region. Source of Hire is an absolute game-changer, and it deserves its place on this list because it provides critical data-driven insights that transform how you approach talent acquisition.
So, what exactly is Source of Hire? Simply put, it tracks the origin of your hires, pinpointing which recruitment channels (think job boards, employee referrals, social media platforms, recruitment agencies, and even your company career page) are delivering the best candidates. This isn't just about quantity; it's about quality too! Source of Hire digs deep to reveal which channels are bringing in candidates who not only accept offers but also thrive in their roles, contributing to your company's success.
How does it work its magic? By meticulously tracking and categorizing every candidate's journey, Source of Hire reveals the effectiveness of each channel. Imagine this: you've been pouring resources into LinkedIn, but your data reveals that employee referrals consistently yield candidates who stay longer and perform better. That's actionable intelligence! You can now reallocate your budget and efforts to maximize the impact of your referral program, building a stronger, more engaged workforce.
Features that fuel your recruitment engine:
Comprehensive Channel Tracking: Monitor all your recruitment avenues, from online platforms like Indeed and LinkedIn to offline sources like university recruitment fairs and networking events. Gain a holistic view of your recruitment ecosystem!
Quality *and* Quantity Measurement: Don't just focus on the number of applicants; assess the caliber of talent each channel attracts. Track metrics like time-to-fill, cost-per-hire, and even performance reviews to understand which sources deliver the best long-term hires.
ROI Analysis: Understand the return on investment for each sourcing method. Are those expensive job board postings truly worth it? Source of Hire helps you make data-driven decisions about where to invest your recruitment dollars.
Budget Optimization: Armed with powerful insights, you can fine-tune your recruitment marketing budget, shifting resources towards high-performing channels and eliminating ineffective strategies. Maximize your impact and minimize wasted spend!
Real-World Success Stories:
Zappos, known for its vibrant company culture, discovered that employee referrals result in employees with 25% longer tenure. This insight empowered them to double down on their referral program, building a stronger, more cohesive workforce.
HubSpot, a leading marketing software company, found that LinkedIn generated the highest quality technical hires, allowing them to focus their efforts and budget on this platform for specialized roles.
Starbucks, a global coffee giant, leveraged Source of Hire data to optimize its sourcing mix, ensuring a steady stream of qualified candidates for various roles across its vast network.
Actionable Tips for Latvian Recruiters:
Dual Attribution Tracking: Track both the first source (where a candidate initially encountered your company) and the last source (the channel that ultimately led them to apply). This provides a more nuanced understanding of the candidate journey.
Quality over Quantity: Don't be blinded by sheer volume. Focus on quality metrics like performance ratings, retention rates, and cultural fit to assess the true value of each source.
Regular Review and Updates: The recruitment landscape is constantly evolving. Regularly review and update your source categories to stay ahead of the curve. In Latvia market, this is especially crucial!
Role-Specific Strategies: Recognize that different roles may require different sourcing approaches. A highly specialized technical role might benefit from targeted LinkedIn campaigns, while entry-level positions might be best filled through local job boards or university partnerships.
Pros and Cons – Weighing the Balance:
Pros:
Identifies the most effective recruitment channels, saving you time and resources.
Optimizes your recruitment marketing budget, maximizing your ROI.
Helps build stronger, more data-driven sourcing strategies.
Provides valuable data for vendor negotiations (think recruitment agencies and job boards).
Cons:
Attribution can be complex with multiple touchpoints in the candidate journey.
May not capture the full candidate journey, especially for passive candidates.
Channel effectiveness can vary significantly by role type.
Requires consistent tracking and categorization for accurate insights.
Implementing Source of Hire isn't just a best practice; it's a necessity for any organization aiming to optimize its recruitment efforts, particularly in Latvia market. By understanding where your best hires come from, you can refine your strategies, attract top-tier talent, and build a winning team.
5. Candidate Experience Score: The Secret Weapon for Attracting Top Talent
In today's competitive talent market, providing a stellar candidate experience is no longer a "nice-to-have"—it's a must-have. That's where the Candidate Experience Score comes in, a powerful recruiting metric that can transform your hiring process and boost your employer brand. This metric gives you a direct line to the thoughts and feelings of your candidates, providing invaluable insights to optimize every step of your recruitment journey. For recruiters in Latvia region, where competition for top talent is fierce, understanding and leveraging the Candidate Experience Score can be the key to unlocking a world of hiring success.
So, what exactly is the Candidate Experience Score? It's a comprehensive measure of how candidates perceive their interactions with your company throughout the hiring process. This includes everything from initial contact and application process to interviews, communication, and even post-decision feedback. By gathering feedback on multiple touchpoints, you gain a holistic view of your strengths and weaknesses, empowering you to create a truly candidate-centric experience.
Features that Fuel Success:
Multi-Touchpoint Measurement: The Candidate Experience Score doesn't just look at the end result – it examines the entire journey. This allows you to pinpoint specific areas for improvement, whether it's streamlining your application process or enhancing communication between interviews.
Quantitative and Qualitative Data: This metric goes beyond simple numerical ratings. By incorporating open-ended feedback, you gain a richer understanding of why candidates feel a certain way, uncovering valuable insights that numbers alone can’t reveal.
Trend Tracking: Monitoring trends in your Candidate Experience Score over time, and even segmented by hiring team, helps you identify patterns and measure the effectiveness of your improvement efforts. This allows you to continuously refine your strategies and stay ahead of the curve.
Reap the Rewards:
The benefits of prioritizing Candidate Experience are undeniable:
Elevated Employer Brand: A positive candidate experience translates directly to a stronger employer brand. Happy candidates become brand ambassadors, spreading positive word-of-mouth and attracting top talent to your organization. In a vibrant market like Latvia, this positive buzz can be invaluable.
Process Optimization: Identifying pain points in your recruitment process allows you to streamline operations, reduce time-to-hire, and improve overall efficiency.
Increased Conversion Rates: When candidates have a positive experience, they're more likely to accept your job offers. This is especially critical in the competitive Latvian tech scene, where top candidates often have multiple offers on the table.
Talent Community Building: Even candidates who don't receive an offer can become valuable members of your talent community if they've had a positive experience. Nurturing these relationships can pay off down the line when new opportunities arise.
Overcoming the Challenges:
While the Candidate Experience Score offers tremendous value, there are some challenges to consider:
Low Response Rates: Not all candidates will take the time to complete surveys, potentially skewing the results. Incentivizing participation and keeping surveys short and sweet can help boost response rates.
Negative Bias: Candidates with negative experiences are often more motivated to provide feedback, which can create a bias in the data. It's important to consider this bias and actively solicit feedback from all candidates.
Standardization Difficulties: Creating standardized surveys across different roles can be challenging. Tailoring questions to specific roles and departments can ensure more relevant and actionable feedback.
Tips for Success:
Mobile-First Surveys: Make sure your surveys are easily accessible and completable on mobile devices.
Timely Feedback Requests: Send surveys promptly after key interactions to capture fresh perspectives.
Transparency and Action: Share feedback with hiring teams regularly and demonstrate that you're taking action based on the insights received.
Real-World Examples:
Companies like Virgin Media, GE, and Hilton have seen incredible results by prioritizing candidate experience. Virgin Media saved millions by improving their candidate experience, while GE uses Candidate Net Promoter Scores (NPS) to benchmark their recruiting teams. Hilton boosted offer acceptance rates by a significant margin through focused experience improvements. These success stories demonstrate the tangible impact of investing in a positive candidate journey.
For recruitment and talent acquisition agencies, tech startups, HR managers, and growing companies in Latvia region, the Candidate Experience Score is an essential recruiting metric. By understanding and leveraging this powerful tool, you can gain a competitive edge, attract top talent, and build a strong employer brand that resonates with the best candidates in the market.
6. Offer Acceptance Rate
Offer Acceptance Rate (OAR) is a crucial recruiting metric that reveals the percentage of candidates who accept your job offers. It’s a powerful indicator of your company's attractiveness to top talent, reflecting the competitiveness of your compensation and benefits, the strength of your employer brand, and the effectiveness of your interview process. A high OAR signifies that your recruitment strategies are resonating with candidates and that you’re effectively selling the opportunity to join your team. For businesses in the competitive Latvia region, understanding and optimizing your OAR is essential for securing the best talent.

Calculating your OAR is straightforward: simply divide the number of accepted offers by the total number of offers extended. For instance, if you made 20 offers and 15 were accepted, your OAR is 75%. This seemingly simple calculation provides a wealth of information. It's not just about the numbers; it's about understanding what those numbers tell you about your recruiting process.
The real power of OAR lies in its ability to be segmented. By tracking OAR by role, level, department, and even candidate source, you can pinpoint specific areas of strength and weakness. Perhaps your engineering team boasts a stellar 90% OAR, while your sales team struggles at 50%. This disparity immediately highlights an area requiring attention – are sales salaries competitive? Is the interview process effectively communicating the role's potential? This granular analysis allows you to target improvements and optimize your approach for different segments of your hiring process.
Why is OAR so important, especially in a dynamic market like Latvia?
In a competitive talent landscape like Latvia, a high OAR is more than just a vanity metric. It’s a vital sign of a healthy recruitment process. It signifies that your company is attracting top-tier talent, reducing time-to-fill, and minimizing costly recruitment cycles. A low OAR can indicate issues with your employer branding, compensation packages, or even the candidate experience. It can lead to extended hiring timelines, increased recruitment costs, and ultimately, settling for less qualified candidates.
Success Stories:
Looking at industry giants can provide inspiration. Facebook, renowned for its competitive compensation and perks, maintains impressively high offer acceptance rates, often exceeding 85%. Adobe reportedly improved its acceptance rates by 15% by focusing on enhanced candidate communication, demonstrating the power of a positive candidate experience. Airbnb strategically tracks acceptance rates by candidate source, enabling them to optimize their sourcing strategies and focus on channels yielding the highest return. These examples illustrate how focusing on OAR can translate into tangible improvements in recruitment outcomes.
Actionable Tips for Improving Your OAR:
Conduct Exit Interviews with Offer Decliners: Don’t let valuable feedback slip away. Understanding why candidates decline offers provides crucial insights into areas for improvement, whether it’s compensation, career progression opportunities, or company culture.
Benchmark Offers Against Market Data: Ensure your compensation packages are competitive within Latvian market. Use salary surveys and industry benchmarks to stay ahead of the curve and attract top talent.
Set Proper Expectations Throughout the Process: Transparency and clear communication are essential. Ensure candidates understand the role, responsibilities, and company culture from the outset to minimize surprises and ensure a good fit.
Track Trends by Role and Compensation Level: Identify patterns and areas needing attention. Are certain roles consistently experiencing low OAR? Is there a correlation between compensation level and acceptance rates? Data-driven insights enable targeted improvements.
Craft a Compelling Employer Value Proposition: Showcase what makes your company a great place to work. Highlight career development opportunities, company culture, and benefits to create an attractive proposition for potential hires.
Pros of Tracking Offer Acceptance Rate:
Simple to Calculate and Track: Easily monitor your progress and identify trends.
Indicates Competitiveness of Offers: Quickly assess if your compensation and benefits are aligned with market expectations.
Helps Identify Compensation or Benefits Gaps: Pinpoint areas where adjustments may be needed to attract top talent.
Quick Indicator of Market Positioning: Gauge your company’s attractiveness relative to competitors in Latvian region.
Cons of Relying Solely on Offer Acceptance Rate:
Doesn't Explain Reasons for Rejection: While it highlights a problem, it doesn't provide the full context. Further investigation, like exit interviews, is necessary.
May Encourage Over-Offering to Improve Rates: Focusing solely on increasing OAR can lead to unsustainable salary inflation.
Can be Influenced by External Market Factors: Economic downturns or sudden surges in demand for specific skills can impact acceptance rates regardless of your internal efforts.
Doesn't Account for Offer Quality or Fit: A high OAR doesn’t necessarily mean you’re hiring the right people. It's crucial to balance OAR with other quality-of-hire metrics.
By diligently tracking and analyzing your Offer Acceptance Rate, you can gain a competitive edge in the Latvia talent market, secure top-tier candidates, and build a thriving workforce. This metric, when used strategically, can be a game-changer for your recruitment efforts.
7. Time to Productivity: Supercharge Your New Hires' Impact!
Time to Productivity (TTP) is a crucial recruiting metric that measures how long it takes for new hires to become fully productive and contribute meaningfully to their roles. It's not just about filling a position; it's about ensuring your new team members quickly become valuable assets. This metric gives you a powerful lens through which to evaluate the effectiveness of your entire talent acquisition process, from initial sourcing to onboarding and beyond. For recruiters in the Latvia region, where competition for talent is fierce and rapid growth is paramount, understanding and optimizing TTP is essential for staying ahead of the curve.
How does it work?
TTP tracks the time from a new hire's start date to the point where they reach full productivity. This "full productivity" point will naturally vary significantly depending on the role's complexity, the industry, and even the individual. For example, a sales representative might be considered fully productive when they close their first deal, while a software engineer's milestone could be the successful completion of their first project. Essentially, it's the moment they transition from learning and adapting to actively contributing to the team's goals.
Why TTP Deserves a Spot on Your Metrics Dashboard
In today’s fast-paced business environment, time is money. A lengthy onboarding period can strain resources and hinder project timelines. By tracking TTP, you gain valuable insights into both the quality of your recruitment process and the effectiveness of your onboarding program. This metric shines a light on areas for improvement, allowing you to fine-tune your approach and achieve a faster return on your recruitment investment.
Features and Benefits: Unpacking the Power of TTP
Combines Recruitment and Onboarding: TTP provides a holistic view of the talent acquisition journey. A short TTP suggests you're not only hiring the right people but also integrating them efficiently.
Data-Driven Optimization: By analyzing TTP data, you can identify bottlenecks in your processes. Are your selection criteria effectively identifying candidates with the necessary skills? Is your onboarding program adequately preparing new hires for their responsibilities? TTP data helps you answer these critical questions.
ROI of Recruitment: Demonstrating a reduced TTP can showcase the value of your recruitment efforts to stakeholders. It provides concrete evidence of the positive impact your work has on the bottom line.
Real-World Success Stories: Inspiration for Your Own TTP Journey
Several companies have achieved remarkable results by focusing on TTP:
Accenture slashed their time to productivity by a staggering 30% by implementing a more robust skills assessment process during recruitment. This ensured new hires possessed the necessary skills from day one.
McDonald's optimized their hiring criteria to better align with the demands of specific roles, resulting in a significant improvement in new employee ramp-up time.
Dell tracks "time to first successful project completion" for technical roles, providing a clear, measurable metric for TTP.
Actionable Tips for Implementing and Tracking TTP:
Define Clear Milestones: Collaborate with hiring managers to establish specific, measurable, achievable, relevant, and time-bound (SMART) productivity milestones for each role. This ensures consistent measurement across the organization.
Track Both Recruitment *and* Onboarding: Don't just focus on the onboarding phase. Analyze data from the entire recruitment lifecycle to pinpoint areas for improvement, from initial sourcing to the final interview.
Refine Job Requirements and Selection Criteria: Use TTP data to fine-tune your job descriptions and selection criteria. This will help attract candidates who are a better fit for the role and reduce the time it takes for them to become productive.
Set Realistic Expectations: Work with hiring managers to establish realistic expectations for new hires. This helps avoid unnecessary pressure and allows new employees to acclimate effectively.
Pros and Cons: Weighing the Benefits and Challenges
Pros:
Measures true hiring success and business impact
Identifies opportunities to improve selection criteria
Helps optimize onboarding and training programs
Provides ROI data for recruitment investments
Cons:
Difficult to define and measure consistently
Varies widely by role and individual
Influenced by factors beyond recruitment
Requires long-term tracking and patience
Despite the challenges, the valuable insights gained from tracking TTP far outweigh the effort required. By consistently measuring and analyzing this metric, you can significantly enhance your recruitment process, onboard new hires more effectively, and ultimately boost your organization's bottom line. For businesses in the competitive Latvia region, focusing on TTP can be a game-changer.
8. Recruitment Funnel Conversion Rates
Want to supercharge your hiring process and build a dream team? Recruitment Funnel Conversion Rates are your secret weapon! This powerful metric tracks the percentage of candidates who successfully move from one stage of your hiring process to the next, illuminating bottlenecks and revealing opportunities to optimize your recruitment pipeline. This is a must-have metric for any organization serious about efficient and effective hiring, especially here in the competitive Latvia region.
Recruitment Funnel Conversion Rates provide a clear picture of candidate flow, from initial application to final offer. By analyzing these rates, you can pinpoint exactly where candidates are dropping off and diagnose the underlying causes. Are too many applicants failing your initial screening? Is your interview process too lengthy or cumbersome? These are the kinds of questions that conversion rates can help you answer. This granular view allows you to make data-driven decisions, refine your strategies, and ensure that you're attracting and retaining top talent.
This approach works by breaking down your hiring process into distinct stages, such as application, phone screen, first interview, and offer. You then calculate the percentage of candidates who progress from one stage to the next. For example, if you receive 100 applications and 20 candidates make it to the phone screen, your application-to-phone screen conversion rate is 20%. Tracking these rates across all stages provides valuable insights into your overall hiring efficiency.
Many successful companies leverage recruitment funnel conversion rates to optimize their hiring processes. Spotify, for example, used funnel analysis to identify and address bottlenecks, resulting in a remarkable 40% improvement in their phone screen to final interview conversion rate! Dropbox uses similar analysis to identify and mitigate potential bias in their screening process, promoting diversity and inclusion. Even LinkedIn, a giant in the professional networking world, tracks conversion rates by recruiter to identify and share best practices.
Here are some actionable tips to get you started:
Define Clear Stages: Establish clear and consistent definitions for each stage of your recruitment process. This ensures accurate and comparable data across your entire hiring pipeline.
Track Quality Alongside Quantity: Don't just focus on conversion rates alone. Also, track quality metrics, such as candidate experience scores and performance reviews, to ensure you're not sacrificing quality for speed.
Address Drop-off Points: Identify the stages with the lowest conversion rates and investigate the reasons behind the drop-offs. Are your screening criteria too stringent? Is your interview process too intimidating? Address these issues to improve candidate flow.
Benchmark Against Industry Standards: Compare your conversion rates to industry benchmarks for similar roles to identify areas for improvement and understand how your performance stacks up against competitors.
When should you use this approach? Always! Whether you're a tech startup seeking scalable hiring solutions, an HR manager at a growing company, or a recruiter for a small to medium-sized enterprise in the Latvia region, understanding your Recruitment Funnel Conversion Rates is crucial for building a strong talent pipeline.
Why does this deserve a spot on our top recruiting metrics list? Simply put, it provides actionable insights into the health and efficiency of your entire hiring process. It allows you to identify areas for improvement, optimize your recruiter's time and effort, improve capacity planning, and ultimately, enhance your overall process efficiency.
Pros: Identifies specific process improvement opportunities, helps optimize recruiter time and effort, enables better capacity planning, and improves overall process efficiency.
Cons: Requires consistent stage definitions and tracking, may encourage a quantity over quality focus if not balanced with other metrics, can be influenced by external factors, and doesn't inherently account for candidate quality at each stage.
The following infographic visualizes a typical recruitment funnel, showcasing conversion rates at key stages: Application, Phone Screen, First Interview, and Offer. It highlights the percentage of candidates moving from one stage to the next, illustrating potential bottlenecks and areas for optimization.
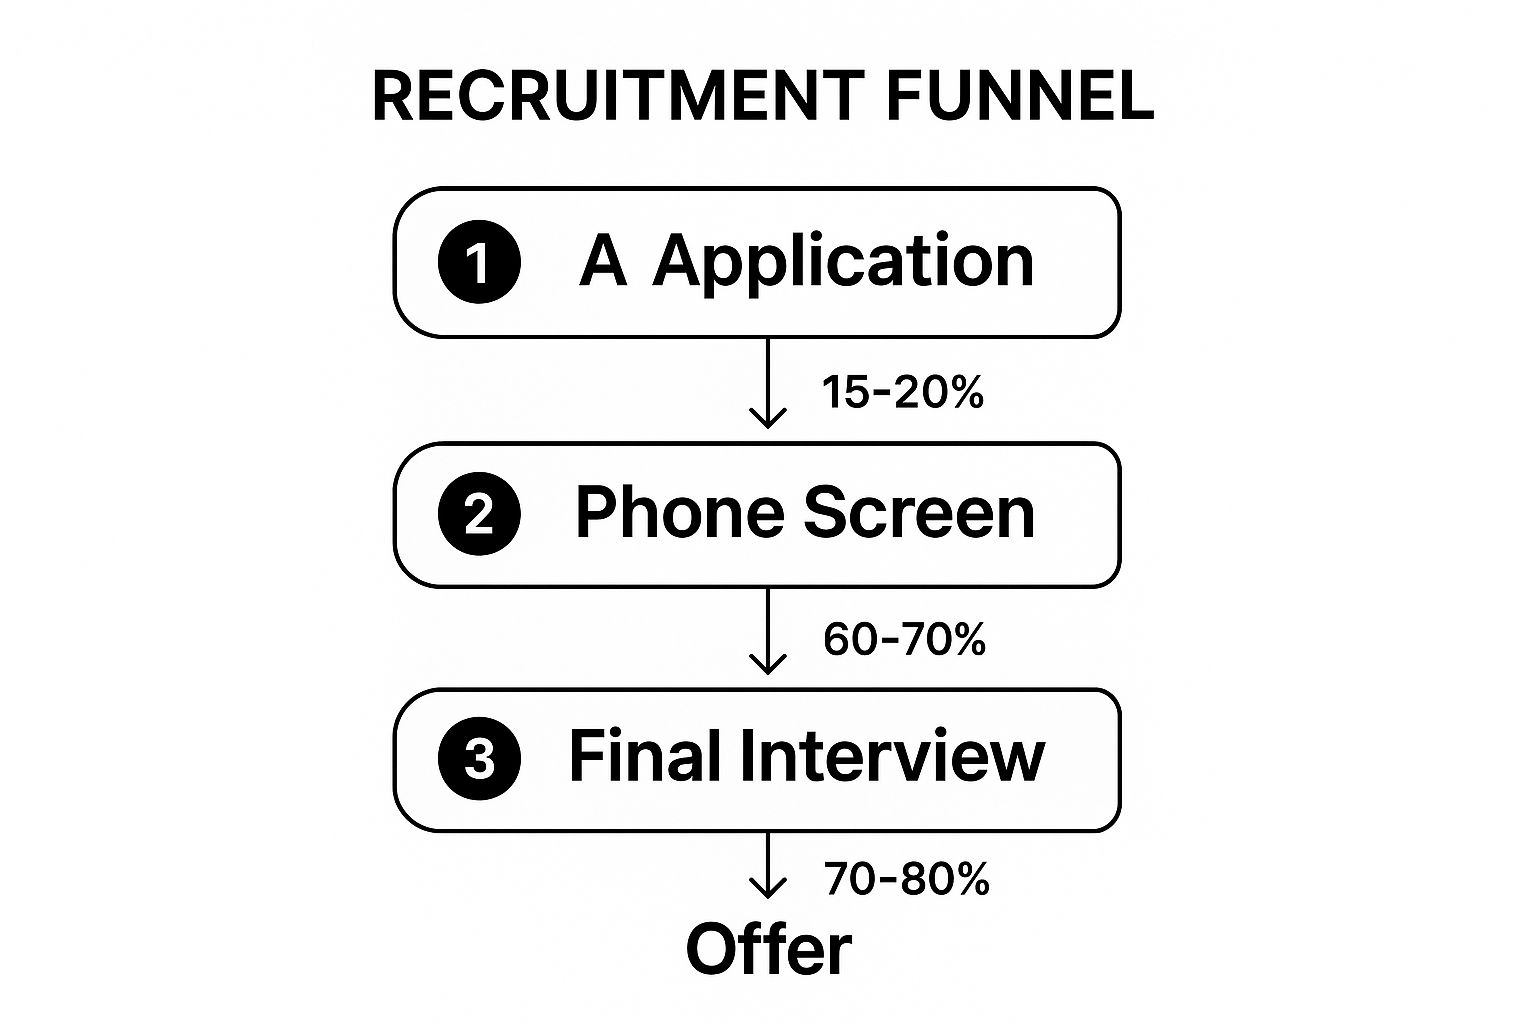
As the infographic demonstrates, the biggest drop-off typically occurs between the application and phone screen stage, indicating a potential area for improvement in attracting and screening initial applicants. Optimizing this stage could significantly impact overall hiring efficiency.
Key Recruiting Metrics Comparison
Metric | Implementation Complexity 🔄 | Resource Requirements ⚡ | Expected Outcomes 📊 | Ideal Use Cases 💡 | Key Advantages ⭐ |
|---|---|---|---|---|---|
Time to Fill | Low - simple to calculate | Moderate - data from recruitment system | Insights on recruitment timeline efficiency | Identifying hiring delays and process bottlenecks | Easy to understand; benchmarks hiring speed |
Cost per Hire | Medium - requires detailed cost tracking | High - needs cost data aggregation | ROI evaluation of recruiting spend | Budget optimization and sourcing channel analysis | Clear ROI view; optimizes budget allocation |
Quality of Hire | High - complex, long-term performance tracking | High - needs performance and retention data | Measures hiring success and employee impact | Aligning recruitment with business results | True measure of hiring effectiveness |
Source of Hire | Medium - tracking multiple channels | Moderate - needs consistent sourcing data | Identifies best recruitment channels | Optimizing marketing spend and sourcing strategy | Improves channel ROI; builds sourcing strategy |
Candidate Experience Score | Medium - requires survey deployment | Moderate - survey tools and analysis | Enhances employer brand and candidate satisfaction | Improving recruitment process and candidate relations | Improves brand; identifies process gaps |
Offer Acceptance Rate | Low - ratio calculation | Low - basic offer and acceptance data | Indicates offer competitiveness and market fit | Evaluating compensation and candidate engagement | Simple metric; signals market strength |
Time to Productivity | High - long-term and multifactor measurement | High - performance tracking and manager input | Measures onboarding and recruitment effectiveness | Improving onboarding and role readiness | Connects hiring to business impact |
Recruitment Funnel Conversion Rates | Medium - stage tracking required | Moderate - consistent stage data collection | Identifies process bottlenecks and conversion rates | Optimizing recruitment stages and resource use | Pinpoints drop-offs; improves process efficiency |
Elevate Your Recruiting Strategy with Yena and Data-Driven Metrics
Mastering recruiting metrics is no longer a luxury—it's a necessity for success in today's competitive talent landscape. Throughout this article, we’ve explored eight essential recruiting metrics, from time-to-fill and cost-per-hire to candidate experience and offer acceptance rate. By focusing on these key performance indicators (KPIs), you gain a clear understanding of your hiring process strengths and weaknesses, enabling you to make informed decisions that drive better hires and ultimately impact your bottom line. Remember, optimizing your recruitment funnel conversion rates, shortening time-to-productivity, and improving your quality of hire directly contribute to a stronger, more productive workforce.
The real power lies in turning these insights into action. Start by prioritizing the metrics most relevant to your current hiring goals. Are you struggling with lengthy hiring cycles? Focus on time-to-fill and recruitment funnel conversion rates. Is budget a concern? Dive deep into cost-per-hire and source of hire. By consistently tracking and analyzing your recruiting metrics, you’ll unlock the data-driven insights needed to refine your strategies, build a powerful employer brand, and create a positive candidate experience, particularly crucial here in the vibrant Baltics region.
Imagine a streamlined recruitment process where data works for you, not against you. This vision can be a reality. Ready to transform your recruiting metrics from simple numbers into actionable insights? Explore how Yena, the AI-driven ATS, can automate your workflow, track these key metrics, and empower you to make data-driven decisions. Visit Yena today and discover how to build a world-class team that propels your business forward.
Comments